SiteAudit Hosted PBI Dashboard is a partner and a customer facing operations dashboard.
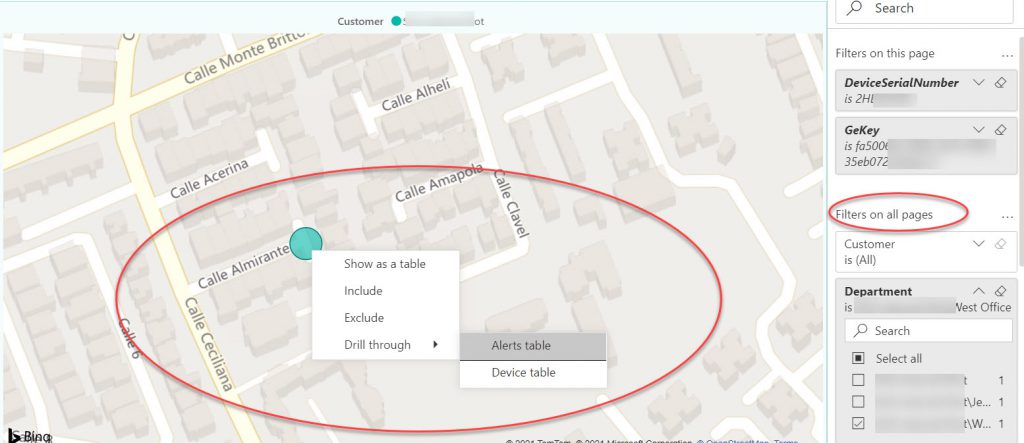
Use the Power BI (PBI) dashboard – the SiteAudit PBI Dashboard utilizes Drill Through to allow topline overview down to the single device detail. Example: use the map to drill through to an exact location and device and the specific supply requiring replenishment.
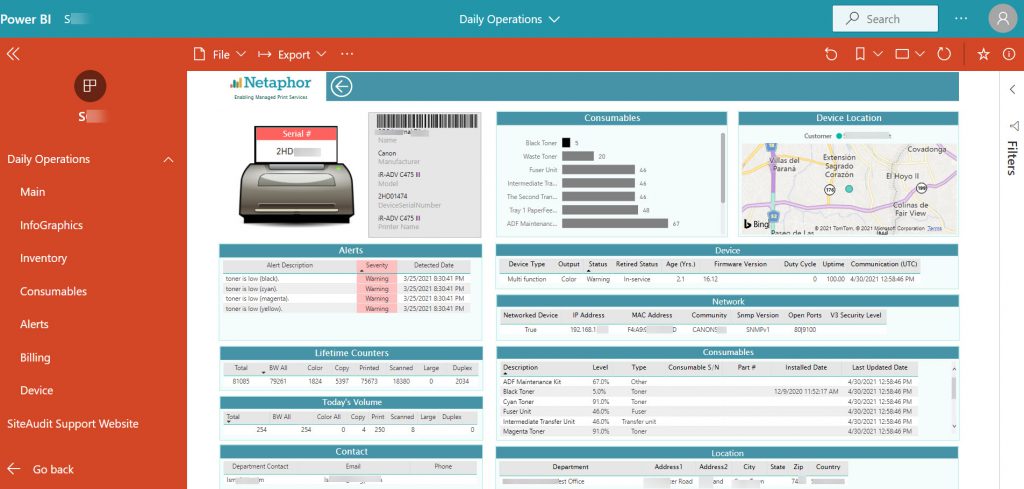
Drill down to the specific customer location. Then Drill Through to the devices at that location to manage supplies, alerts, and more.
Fleet managers can start at the Operations Dashboard to see Critical Supplies. See example there are 2 critical supplies that are less than 10% supplies remaining.
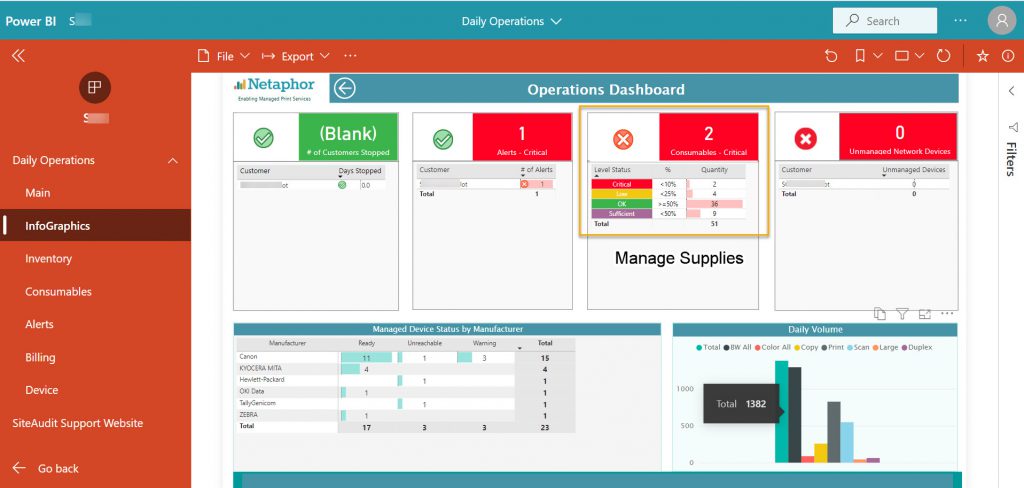
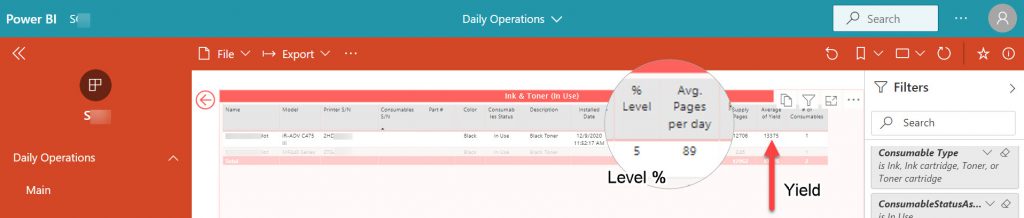
Then Drill Through to the supplies report to see more details.
SiteAudit PBI Dashboard Capability Summarized:
- Manage fleet operations from inventory to supplies
- Analyze fleet data from utilization to volume trends
- Filter data and select specific time periods for analysis
- Drill Through from fleet overview to device level
- Visualize customer locations with Bing Maps
- Manage single or multiple customers in a single view
- Access protected by Azure AD login
- Export charts to Excel .xlsx or .csv, PowerPoint and PDF