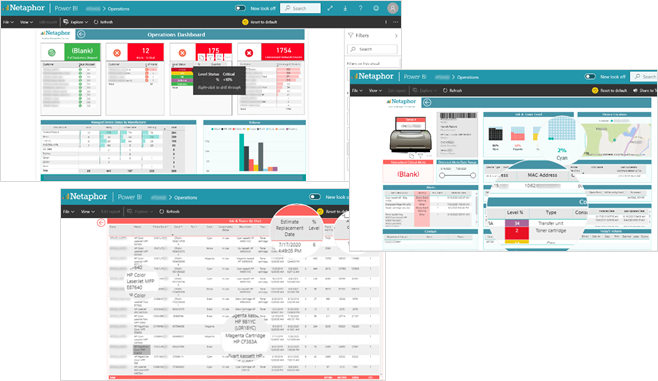
Using the SiteAudit PBI Dashboards makes managing customer fleets an effortless and productive experience. Fleet managers can manage supplies operations, respond to critical incidents, or check physical inventory locations using geographic mapping. Netaphor partners can check fleet performance and security threats and uncover sales opportunities. There are both partner and customer facing dashboards.
PBI Dashboard Capabilities
– Manage fleet operations, check customer performance, and see sales opportunities
– Visual SiteAudit data as charts, graphs, and maps
– Filter data and select specific time periods for analysis
– Drill Through from fleet overview to device level
– Visualize customer locations with Bing Maps
– Manage single or multiple customers in a single view
– Access protected by Azure AD login
– Export charts to Excel .xlsx or .csv, PowerPoint and PDF
Fleet Operations PBI Dashboard

Operations PBI Dashboard Data-sheets
Click to view or right-click to download a datasheet:
English | German | French | Spanish
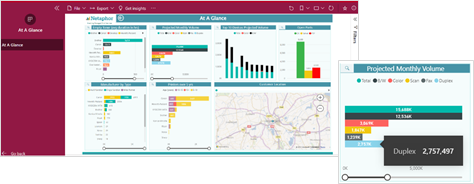
At-A-Glance PBI Dashboard
The At-A-Glance dashboard provides fast, insightful information about fleet assets, projected volumes, supplies issues and security threats. Start with high level analysis to identify key issues, then drill down for more data and analysis and finally view specific device information using the powerful drill through capabilities.

At-A-Glance PBI Dashboard Datasheets
Click to view or right-click to download a datasheet:
English | German | French | Spanish
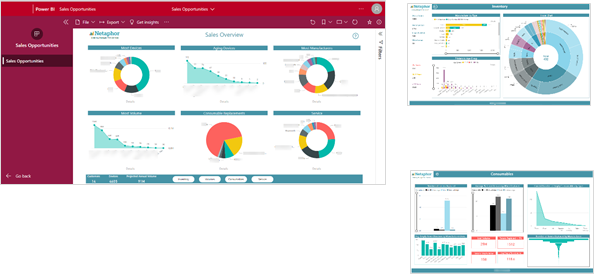
Sales Opportunities PBI Dashboard
The sales dashboard provides visibility into potential customer opportunities based on analysis revealed though the Opportunities dashboard use. These opportunities can lead to hardware and services revenue. A user such as sales manager can identify specific or global customer opportunities to improve customer performance and delegate this to the salesperson to initiate.

Sales PBI Dashboard Datasheets
Click to view or right-click to download a datasheet:
English | German | French | Spanish
