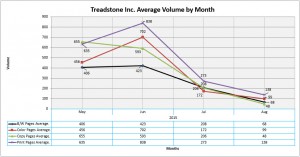
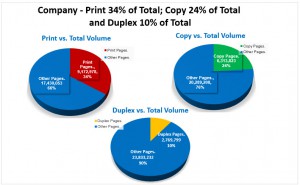
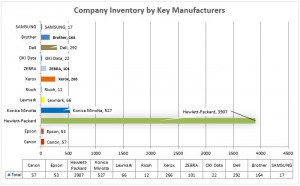
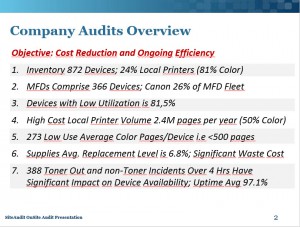
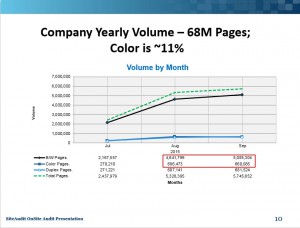
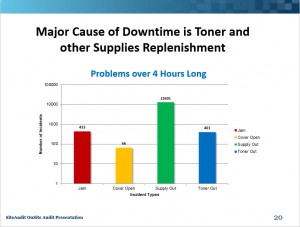
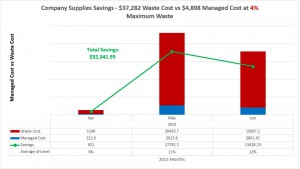
SiteAudit Analyzer is a tool used for fleet analysis and reporting. It works with SiteAudit OnSite, Hosted and Compact software. Once Analyzer is launched a user can select from a set of chart templates. Each template contains multiple charts. SiteAudit templates provide ready-made analysis and charts of inventory supplies, volume and fleet health.
Applications
Use SiteAudit Analyzer for audit analysis, presentation and ongoing fleet consulting. Run Analyzer across a single customer or create a consolidated analysis and presentation across multiple customers. Use the Analyzer MS PowerPoint integration as the standard workflow for audit data to sales presentation.
At-A-Glance
- Audit and Fleet Management
- Fleet Analysis and Reporting Tool
- All Environments
Key Feature and Benefits

– Fleet Analysis and reporting for audit and fleet management
– Templates with multiple bar, pie and line charts
– Show volume trends in Microsoft PowerPoint or MS Word Reports
– Analyze inventory mix, fleet age and utilization
– Use Analyzer to forecast supply replenishments
– Perform single customer analysis or across multiple customers
– One-Click users easily produce report analysis and charts
– Designer users create custom analysis and charts
– Integrated audit MS PowerPoint presentation
Product Option
Two capability levels are offered. The One-Click license allows the user to easily work with a set of standard chart templates. Templates can be filtered within the data fields presented. The Designer license provides users with One-Click capability plus the capability to create custom templates to meet any reporting requirement.
Analyzer Chart Samples
English | German | French | Spanish | Dutch
Click to view or right-click to download the sample:
Datasheets
Click to view or right-click to download a datasheet:
English | German | French | Spanish | Dutch | Portuguese | Russian

